Category: Technology

  • Top 10 Most Popular Tech Podcasts: New Study Unveiled

    Top 10 Most Popular Tech Podcasts: New Study Unveiled

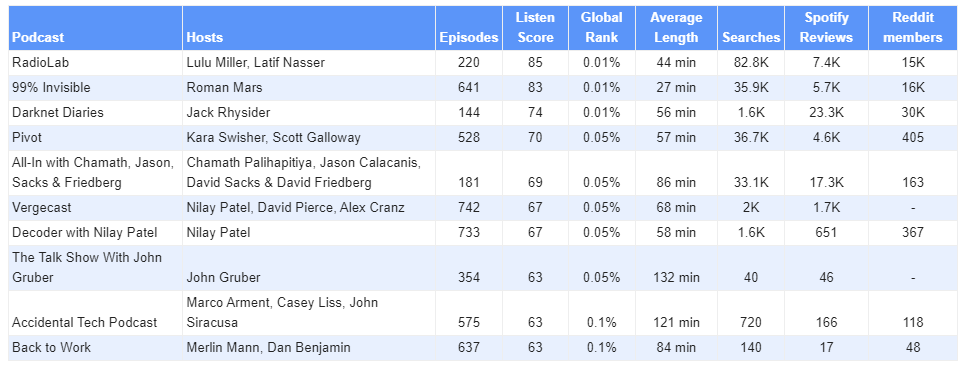
    A recent study by AI link-building software company, Linkee.ai, has revealed the latest ranking of the most popular tech podcasts. The analysis considered several factors, including the number of episodes, average length, global ranking, Google searches, and Spotify reviews. The final ranking was determined based on the listen score from Listen Notes, with some surprising results.

    1. Radiolab

    Topping the list is Radiolab, with a listening score of 85, making it the most popular tech podcast in 2024. Known for its investigative journalism into science, technology, and legal history, Radiolab generates over 82K searches monthly and has a loyal fan base with 7.4K reviews on Spotify. The podcast has aired over 200 episodes, making it a critically acclaimed favorite for tech enthusiasts.

    2. 99% Invisible

    Taking the second spot is 99% Invisible with a listening score of 83. With over 640 episodes, this podcast dives into design and architecture, from tech innovations to office space layouts. Despite being close in listening score to Radiolab, 99% Invisible garners fewer searches, attracting 35.9K searches monthly.

    3. Darknet Diaries

    Darknet Diaries claims third place, scoring a listen score of 74. The podcast focuses on hacking, cybercrime, and other digital underworld topics, making it the most-reviewed tech podcast on Spotify, with over 23K reviews. It also boasts a longer average runtime of 56 minutes, drawing listeners into its deep dives into cybercrime.

    4. Pivot

    Pivot, hosted by Kara Swisher and Scott Galloway, ranks fourth with a listen score of 70. This podcast explores the intersections of tech, business, and politics, with over 500 episodes available. Despite its long run, it remains highly popular with 36.7K monthly searches.

    5. All-In

    In fifth place is the All-In podcast, hosted by Chamath Palihapitiya, Jason Calacanis, David Sacks, and David Friedberg. Scoring a listen score of 69, it covers a wide range of topics including economics, tech, and even poker. With over 17K reviews on Spotify and a significant audience reach, All-In continues to gain popularity.

    6. Vergecast

    Vergecast, produced by The Verge, takes the sixth spot with a listening score of 67. Known for its discussions on the latest in tech, this podcast has released the most episodes on this list, with 742 currently available. Each episode runs for just over an hour, making it a staple for tech news followers.

    7. Decoder with Nilay Patel

    In seventh place is Decoder with Nilay Patel, tying with Vergecast with a listening score of 67. Focused on business, technology, and innovation, the podcast has over 700 episodes and remains a go-to for tech enthusiasts seeking deeper insights into the world of tech leadership and trends.

    8. The Talk Show With John Gruber

    The Talk Show With John Gruber lands in the eighth spot with a listen score of 63. A notable podcast for Apple fans, it covers tech, design, and Apple products in great detail. Its longer runtime, averaging 132 minutes, sets it apart from the shorter podcasts on this list.

    9. Accidental Tech Podcast

    Tied for ninth, with the same listen score of 63, is the Accidental Tech Podcast. This show focuses on technology, programming, and Apple products. Similar to The Talk Show, it features long episodes, often nearing two hours, giving listeners a deep dive into tech discussions.

    10. Back to Work

    Closing out the top 10 is Back to Work, also with a listening score of 63. This podcast takes a different approach, focusing on productivity, work tools, and communication. With 637 episodes, it offers insights into how tech influences the modern work environment.

    Why Tech Podcasts Matter

    According to a spokesperson from Linkee.ai, “Podcasts focused on tech are not only a source of knowledge and entertainment but also a tool that helps to keep track of innovations, new tech startups, and rising trends.” Many of the podcasts in this ranking delve into entire industries, giving listeners a broader view of tech’s role in reshaping the world.

    The ranking provides tech enthusiasts with a diverse list of shows to explore, ranging from investigative journalism to detailed discussions on cybercrime, business, and productivity. Whether you’re new to tech or looking to expand your podcast library, this top 10 list highlights the best in the industry.

  • Prologis’ U.S. Logistics Fund: 20 Years of High-Performing Logistics Assets

    Prologis’ U.S. Logistics Fund: 20 Years of High-Performing Logistics Assets

    Prologis, the global leader in logistics real estate, is marking the 20th anniversary of its U.S. Logistics Fund (USLF), one of its private flagship investment funds, with an assets under management (AUM) of $24 billion. Since its launch in 2004, USLF has delivered consistent,  high returns while playing a key role in driving the growth and modernization of logistics investments across the United States. Prologis is a co-investor in its Strategic Capital funds, including USLF, which strongly aligns its interests with the USLF investors.

    “We have been privileged to serve and partner with our USLF investors over the past two decades,” said Hamid R. Moghadam, chief executive officer and co-founder of Prologis. “USLF not only offers the highest-quality logistics real estate portfolio in the United States, but it is also actively investing in value-creation opportunities which will enhance the long-term value of our assets while driving customer preference and stickiness.”

    Some of the key performance highlights over the past two decades:

    • Strong Record of Outperformance: Since its inception, USLF has consistently delivered outsized returns, positioning it as a leading performer in logistics real estate. This performance is particularly noteworthy given the fund’s low leverage over its 20-year history, minimizing reliance on borrowed capital. USLF’s best-in-class debt ratings have also enabled the fund to secure favorable financing terms, further enhancing returns across various market cycles.
    • Consistent High Occupancy: In the past 10 years, the average operating occupancy of the fund was 96.8%, outperforming the market by 160 bps, driven by the strength of its assets and locations as well as Prologis’ customer-centric approach.
    • Strong Investor Confidence: USLF has attracted capital from a diverse range of 127 institutional investors from 15 countries, demonstrating high trust in its growth potential and long-term value. Since 2004, USLF has provided market-leading liquidity to its investors by funding 100% of redemption requests totaling more than $2.9 billion.
    • Continued Growth and Strategic Expansion: USLF’s tight, focused investment strategy has been key to its success, selectively expanding from 4.5 MSF in 2004 in eight markets to more than 125 MSF in 28 markets today. With assets in some of the most sought-after urban infill locations in key U.S. logistics hubs, including Southern California, New Jersey, Chicago and Atlanta, USLF remains concentrated on high-value logistics centers. The rise of e-commerce has further driven the growth of the fund.

    Looking ahead to its third decade, USLF remains positioned for future growth and success as Prologis continues to innovate to deliver value to investors in a rapidly changing industry. With significant investments in proprietary research, data analytics, renewable energy, mobility and other value-enhancing capital improvements to its buildings, Prologis is providing fund investors with access to a best-in-class and future-proofed logistics real estate portfolio.

    “We take a customer-centric approach to every part of our business, including our private investment funds. With USLF, we have curated a portfolio of modern logistics properties that is unrivaled in the industry,” said Karsten Kallevig, global head of Strategic Capital. “While we are proud of USLF’s accomplishments over the years, we are even more excited about what the future holds for our partnership with our investors.”

    About Prologis Strategic Capital

    Prologis’ Strategic Capital business is an integral line of business for the company, with $87.0 billion* in assets under management. Its Strategic Capital business consistently delivers strong and sustained revenue growth. 

    Prologis Strategic Capital offers institutional investors a unique opportunity to invest with the company. Benefitting from the scale and scope of the Prologis platform, each of the company’s 10 funds focus on delivering industry-leading, risk-adjusted returns along with a superior investor experience. Prologis’ investment vehicles have specific geographic and risk profiles, targeting logistics real estate in high-consumption and high-barrier-to-entry markets. 

    Prologis is a material investor in all its Strategic Capital funds, with co-investment levels ranging from 15 percent to 55 percent. As a general partner, the company provides investors security through its durable A-rated balance sheet, best-in-class global portfolio and customer-centric focus.

    * Data as of June 30, 2024. AUM is the fair value of real estate properties and development projects in the Strategic Capital business and includes our estimate of the gross value of real estate that could be acquired using existing equity commitments from Prologis and our partners assuming target leverage levels are used. Assets Under Management: Representing 44% of Prologis’ total AUM.

    ABOUT PROLOGIS
    Prologis, Inc. is the global leader in logistics real estate with a focus on high-barrier, high-growth markets. At June 30, 2024, the company owned or had investments in, on a wholly owned basis or through co-investment ventures, properties and development projects expected to total approximately 1.2 billion square feet (115 million square meters) in 19 countries. Prologis leases modern logistics facilities to a diverse base of approximately 6,700 customers principally across two major categories: business-to-business and retail/online fulfillment.

  • Security Experts Share 5 Security Essentials Every Airbnb Host Needs to Know

    Security Experts Share 5 Security Essentials Every Airbnb Host Needs to Know

    Essential tips to protect property and ensure guest safety in the short-term rental market

    Key Points:

    • Security experts outline five key tips for Airbnb hosts to mitigate risks in their properties and ensure a safe environment
    • Concerns over security for short-term rental hosts and guests can significantly impact reputations and financial outcomes
    • Implementing security measures protects properties and enhances guest experience and trust

    With over 448 million Airbnb nights and experiences booked in 2023, the platform’s explosive growth has brought new challenges for hosts, particularly around security. As more travelers use Airbnb, the risks of security breaches increase, which can not only damage a host’s reputation but also lead to significant financial losses. Taking active steps to protect property and ensure guest safety is more important than ever.

    “The sheer scale of Airbnb’s global user base has amplified security risks,” say home security experts at Automatic Technology (ATA). “Hosts need to go beyond offering a clean and comfortable space—they need to implement effective security measures to protect their property and guests from potential threats.”

    Top 5 Security Essentials for Airbnb Hosts

    1. Install smart locks and keyless entry systems 

    Smart locks enable hosts to generate unique access codes for each guest, eliminating the need for physical key exchanges and reducing the risk of unauthorized access.

    “Smart locks are a game-changer,” says ATA. “They not only enhance security but provide convenience for both hosts and guests. Changing access codes between stays ensures no one can re-enter without permission.”

    2. Set Up Outdoor Security Cameras

    With Airbnb’s ban on indoor security cameras earlier this year, hosts must focus on securing outdoor areas. Cameras placed at entrances, driveways, and other external spaces act as deterrents while respecting privacy rules.

    “Outdoor security systems ensure safety while maintaining guest privacy, which is a concern for all short-term rental hosts,” advises ATA.

    3. Invest in a secure Wi-Fi network with guest-specific access 

    Secure Wi-Fi protects both the host’s and guests’ data. Setting up a separate network for guests, distinct from the one controlling smart home devices, ensures privacy.

    “Many hosts overlook the importance of network security,” warns ATA. “A compromised network can lead to data breaches, potentially affecting not just current guests but future bookings as well.”

    4. Implement smart home security systems

    Integrating devices like smoke detectors, carbon monoxide alarms, and motion sensors into a centralized system alerts both hosts and guests to potential dangers in real time.

    “Smart home security systems provide an extra layer of protection,” says ATA. “They can detect issues early, preventing potential disasters and showing guests that their safety is a top priority.”

    5. Establish clear safety protocols and emergency plans 

    Providing detailed guides for guests, including emergency exit plans, important local contact numbers, and instructions for using security features, enhances guest safety and comfort.

    “Clear communication about safety measures can significantly boost guest confidence,” notes ATA. “It demonstrates professionalism and care, which often leads to better reviews and increased bookings.”

    A spokesperson for Automatic Technology comments:

    “Security has become an absolute necessity for Airbnb hosts. We’ve consistently observed that hosts who implement strong security measures, such as smart locks and cameras, significantly reduce risks while also increasing guest trust. When guests feel safe, it both enhances their stay and often results in better reviews and more frequent bookings, giving hosts a clear competitive edge in the market.”

    Methodology

    Stat on airbnb user base was collected by Statista

  • These Are The Most Common Times Burglars Target Your Home (And How To Foil Them)

    These Are The Most Common Times Burglars Target Your Home (And How To Foil Them)

    Home security experts reveal the most likely time a home will be burgled – and how to frustrate criminals’ attempts

    Key Findings:

    • Home security experts explain why certain times of the day and year are more attractive to criminals
    • Criminals target homes during daytime working or school hours, over the holidays, and in the summer
    • Experts give their top tips on how to protect a home during these peak times

    Home burglaries are officially the most feared type of property crime in the USA. “The fear of someone hostile breaking into your home – the place you are meant to be most safe – is very powerful,” say the experts at Automatic Technology (ATA), a specialist provider of secure garage doors.  

    Below, the experts at ATA reveal at which times a home is more at risk of burglary and share their advice on making a house a less attractive target for burglars.

    Most Robberies Occur During The Day

    Most people probably picture burglaries happening in the dead of night, when criminals can move under the cover of darkness. “Certainly, many homeowners are worried about criminals getting into the house when they’re asleep, as this is a time they feel vulnerable,” says ATA.

    However, according to FBI data, 65% of robberies occur during the daytime, most commonly between 10 am and 3 pm. This time of day is preferable for criminals because most homeowners will be at work or school. 

    “Most burglars have zero desire to encounter the homeowner,” says ATA. “They want to be in and out as fast as possible with no complications, so they look for times when no one will be home.”

    The Most Popular Season Is Summer

    Summer is the most popular season for robberies. By comparison, a home is 11% less likely to be burgled in the winter. This is because homes are usually easier to access during the summer, with windows and doors left open due to the heat. 

    “Many robberies are planned, but a lot are also the result of a criminal capitalizing on an opportunity, like a window someone forgot to close,” says ATA. “People are also more likely to work or relax outside during the summer months, potentially forgetting to secure items which an opportunistic criminal can then steal.”

    Summer is also when most people go on holiday, leaving their homes unoccupied, making them a target for criminals. 

    Be On Guard During The Holidays

    Although home burglaries are less common in winter, homeowners should still be on guard during the holiday period. Criminals know that high-value presents could be gathered under Christmas trees, waiting to be exchanged, which could make a house a target. 

    “Leaving packaging from a new, expensive present outside your house could also indicate to a criminal that there’s something worth stealing inside your home,” says ATA.

    The experts at Automatic Technology commented:

    “The first step to protecting your home is to lock all your windows and doors before leaving, even if just for a short time. You should also make sure all items of value are inside or stored in a secure shed. These steps might seem simple, but burglaries are often opportunistic. If a criminal happens to try a door that you forgot to lock, that’s all the opening they need.

    “Criminals are usually looking for the house that seems easiest to break into, so an obvious security camera and motion-activated lighting can be highly valuable deterrence tools. A study from UNC Charlotte reported that 60% of burglars would choose another home to target if they identified a security system, so installing cameras and alarms is likely to be a sound investment.”

    Sources

    • Home burglaries are the most feared crime: Safewise.
    • More burglaries occur during the day: FBI.
    • More burglaries occur during summer: US Department of Justice.
    • Burglars are more likely to choose a different target due to spotting cameras: UNC Charlotte.
  • Experts Reveal The Smart Security Upgrades That Significantly Boost Home Appeal and Value 

    Experts Reveal The Smart Security Upgrades That Significantly Boost Home Appeal and Value 

    Top smart security features that attract modern homebuyers and increase property value

    Key findings:

    • Smart security upgrades like cameras, locks, and integrated systems are becoming essential in modern homes
    • These features can differentiate a property in the competitive real estate market, particularly appealing to first-time and tech-savvy homebuyers
    • Investing in smart security technologies can lead to higher offers and quicker sales

    Smart security features are rapidly becoming the new must-haves in modern homes, as buyers increasingly prioritize both safety and convenience. In fact, according to the National Association of Realtors, 77% of home buyers are now interested in smart home technology. Beyond enhancing security, these systems are proving to be valuable assets, potentially boosting a property’s appeal and market value.

    “Smart home security features have become a major selling point in recent years,” explains a security professional at Automatic Technology (ATA), a leading provider of innovative garage door and gate openers. “Data shows that homes equipped with comprehensive smart security systems are commanding noticeably higher prices compared to those without.”

    With smart security upgrades becoming an incredibly attractive investment, especially for those planning to sell their property, ATA shares their list of the best upgrades for adding value to a home. 

    Top Smart Security Upgrades That Add Value to Homes

    1. Security Cameras

    Security cameras equipped with motion-activated lights serve a dual purpose—surveillance and illumination. 

    “These devices not only deter potential intruders but also provide valuable footage if needed,” explains ATA. 

    While exact data on the exact home value added by security cameras is hard to come by, surveys have shown that insurance premiums can be cut by up to 20% with their installation. On top of that, homes with security systems installed, featuring security cameras, can sell for as much as 3.5% more than those without.

    1. Smart Locks

    NEW

    Smart locks improve security and convenience, allowing you to control access remotely and track who enters or exits your property.

    ‘Smart locks are great tools for homeowners who frequently need to give access to service workers or guests without the hassle of physical keys,’ says ATA.

    Some sources report smart locks contributing over $240.00 to a property’s value. This gives homeowners at least an equal return on their investment while adding security, offering added peace of mind and making the property more attractive.

    1. Integrated Smart Home Security Systems

    Comprehensive systems that integrate various smart devices provide superior security and often lead to significant increases in home value. 

    “Homes with fully integrated smart security systems stand out in the market,” the expert notes. 

    Research indicates that IoT devices can increase a property’s resale value by as much as $363 per square foot, reflecting the growing importance of these systems. 

    4.  Smart Garage Door Openers

    Smart garage door openers offer both enhanced security and convenience, making them a valuable addition to any home.

    “Smart garage door openers allow homeowners to control and monitor their garage door from anywhere using their smartphone,” explains ATA. “This improves security by allowing you to check if you’ve left the door open, while also adding convenience for daily life and when welcoming guests or receiving deliveries.”

    While exact figures on investment returns on smart garage doors are hard to come by, research shows that installing new garage doors nets sellers a 103% return on investment. Furthermore, homes with high curb appeal sell for on average 7%, something that smart garage doors contribute significantly to. 

    The security professional at Automatic Technology comments:

    “When you invest in smart security, your upgrades often can make a noticeable boost in your property’s value and appeal. These features can attract more interest, particularly from first-time buyers who appreciate both the added security and convenience. These upgrades can potentially lead to quicker sales and higher offers, making smart security a valuable investment for improving your home’s overall marketability.”

    Sources

  • Top 10 Most Reliable Work Platforms in 2024: Who Had the Least Outages?

    Top 10 Most Reliable Work Platforms in 2024: Who Had the Least Outages?

    A new study conducted by TRG Datacenters has identified the work-related platforms and services that experienced the least number of major crashes over the past 12 months. The study assessed the performance and reliability of 30 platforms, focusing on factors such as the number of outages, average outage duration, and the total number of affected users.

    Dropbox Leads in Reliability

    Dropbox emerged as the most reliable platform, with only two major outages over the last year. These crashes lasted 45 minutes each and affected a staggering 700 million users worldwide. Despite the large user base, Dropbox was able to quickly resolve issues, earning a reliability score of 69.2, the highest among the platforms surveyed. This exceptional performance under significant pressure highlights Dropbox’s robustness in managing large-scale disruptions efficiently.

    High-Performing Platforms with Minimal Outages

    Asana and Airtable topped the list as the most reliable work platforms, with only one major outage each over the last year. Both platforms had outage durations of just 45 minutes. Asana, with over 1.3 million users, has a significantly larger user base compared to Airtable’s 250,000, demonstrating its ability to maintain stability despite serving a broader audience. Both platforms received a reliability score of 61.5, reflecting their commitment to consistent service delivery.

    Several other platforms, including Yammer, Miro, and Basecamp, experienced only two major crashes each. However, Yammer, a Microsoft-owned platform with 345 million users, had a longer average crash duration of 1.5 hours, resulting in a lower reliability score of 58.8. Miro and Basecamp, with 25 million and 3.3 million users respectively, also managed to keep their outages brief, with each crash lasting only 45 minutes. Basecamp received a reliability score of 57.6, slightly lower than Miro’s 57.9, mainly due to its smaller user base.

    Webex, Evernote, SharePoint, and Trello Face More Challenges

    Platforms such as Webex, Evernote, SharePoint, and Trello had slightly more frequent outages, each experiencing three major crashes over the last 12 months. For Webex, these outages lasted an average of 90 minutes and affected around 500 million users globally. Despite its large user base, Webex received a reliability score of 57.3, indicating room for improvement.

    Evernote, which shares the same outage duration as Webex but has a smaller user base of 225 million, also earned a reliability score of 57.3. The study notes that the size of the user base did not have a significant impact on reliability for these platforms, as their scores remained comparable.

    SharePoint, another Microsoft-owned platform with 345 million users, had an average outage duration of 90 minutes. Trello, on the other hand, had a shorter average outage time of 45 minutes but served a much smaller user base of 50 million. Both platforms scored similarly in reliability, with Trello receiving a slightly lower score of 54.3 compared to SharePoint’s 54.8. This suggests that while Trello was able to resolve issues faster, its smaller user base may not fully reflect the same operational pressures faced by SharePoint.

    Key Insights from TRG Datacenters’ Study

    TRG Datacenters’ study offers a clear insight into the complexities of managing platform reliability at scale. According to a spokesperson from TRG, “The reliability of a platform is easier to maintain when the user base is smaller. The challenges become much greater when a single mistake affects millions or even billions of users, even if the outage is short. When enterprises rely on these platforms to deliver critical services, reliability becomes paramount.”

    The study also highlights that global platforms with users in different time zones may not see the full impact of an outage at any one time, as not all users will be affected simultaneously.

    The Importance of Reliability in Enterprise Platforms

    As businesses increasingly rely on cloud-based platforms for collaboration and workflow management, the reliability of these platforms becomes crucial. Outages, even if brief, can have a significant impact on productivity and operations, particularly for companies with distributed teams and global operations.

    Dropbox’s ability to maintain minimal outages despite its massive user base underscores its value as a reliable platform for enterprises. Similarly, platforms like Asana and Airtable, with their low outage counts and short durations, demonstrate that smaller, focused platforms can deliver high levels of reliability for their users.

    However, platforms like Webex, Evernote, SharePoint, and Trello, which serve larger user bases and experienced more frequent outages, may need to focus on improving their infrastructure and response times to remain competitive in the reliability stakes.

    Methodology Behind the Study

    The research, conducted by TRG Datacenters, analyzed the top 30 work-related platforms based on data from outage reporting services like Downdetector, Statusgator, and Outage Report. The study considered reported outages from the past 12 months, taking into account the duration of each outage and the total number of users affected. A reliability score was assigned to each platform, with major outages defined as incidents where the platform was unavailable with all of its functions.

    This comprehensive approach provided a detailed ranking of the platforms’ reliability, offering valuable insights for businesses and users seeking stable services to support their operations.

    In a digital world where uptime is critical, platforms like Dropbox, Asana, and Airtable stand out for their ability to maintain high levels of reliability. With enterprises depending on these services to manage workflows, communicate, and collaborate, the importance of a strong, dependable platform cannot be overstated. As the study shows, while some platforms face challenges in maintaining reliability under pressure, others have set a high standard for performance in the face of disruptions.

    For enterprises and users alike, understanding the reliability of the platforms they depend on is essential for minimizing downtime and maximizing productivity.

  • Study Shows Top Spam Email-Sending Countries

    Study Shows Top Spam Email-Sending Countries

    Key Highlights:

    • A new study reveals the countries that send out the most spam emails, resulting in the most CO2 emissions to the environment.
    • The Netherlands sends out the largest amount of spam emails daily, amounting to 7.1 billion.
    • Irish email users have the highest carbon footprint from spam emails, totaling  367.6 grams per user. 
    • Only 73% of the Australian population uses email, resulting in the lowest carbon emission per user in the top ten at 93.9 grams.

    A new study by ZeroBounce analyzed 27 highly internet-consuming countries to identify those that send out and receive the most spam emails and thus emit the most CO2 to the environment. The study used the most recent reports of population numbers from the World Population Review. The information about the percentage of email users was retrieved from Statista’s reports. The reports about the number of spam emails sent out per country were taken from the Talos Intelligence website. It is globally recognized that one email transaction emits 0.3 grams of CO2 on average. The carbon footprint was calculated according to the number of emails sent out per country. For clearer results, the grams were translated into tons. Per capita carbon footprint is indicated in grams. 

    Findings summed up

    Country Population % of email usersNumber of email usersSpam Emails sent daily in billionsCarbon footprint of spam emails in tons Carbon footprint of spam emails per user in grams
    Ireland5,089,47893%4,733,214.545.81918.0367.6
    New Zealand5,269,93978.70%4,147,441.994.71554.2340.0
    Denmark5,939,69598.00%5,820,901.1061984.1309.2
    Austria8,977,13980%7,181,711.205.21719.6217.2
    Switzerland8,851,43196.00%8,497,373.765.91951.1208.3
    Belgium11,715,77486.21%10,100,168.776.32083.3187.1
    Sweden10,673,66993.00%9,926,512.175.81918.0175.3
    Netherlands17,671,12590.00%15,904,012.507.12347.9133.9
    Chile19,658,83967.30%13,230,398.655.51818.8124.7
    Australia26,699,48273%19,490,621.866.12017.293.9

    Ireland leads the ranking with the highest daily carbon emissions resulting from spam emails. With 93% of its population, or approximately 4.7 million people, using email, Ireland generates around 5.8 billion spam emails each day. This equates to an average of 1,918 tons of CO2 emitted daily. Each email user in Ireland contributes an average of 367.6 grams to the daily carbon footprint, the highest per capita emission among the countries studied.

    New Zealand ranks second in per capita carbon footprint from spam emails, with each email user emitting an average of 340 grams of CO2. Despite having the lowest total carbon emissions on the list at 1,554 tons per day, New Zealand’s email usage remains significant, with 78.7% of its population, or approximately 4.1 million people, sending or receiving around 4.7 billion spam emails daily.

    Denmark secures third place with daily per capita carbon emissions of 309.2 grams. An impressive 98% of Denmark’s population, or about 5.8 million people, use email, sending or receiving approximately 6 billion spam emails each day. This results in a total of 1,984 tons of CO2 emissions daily, the fourth highest on the list.

    Austria ranks fourth with an average of 217 grams of carbon emissions per capita. Each day, around 5.2 billion spam emails are sent or received by Austrian email users, who make up 80% of the country’s population, leading to a total daily carbon footprint of 1,719.6 tons.

    Switzerland follows closely in fifth place with per capita CO2 emissions of 208.3 grams. Despite having the second-highest percentage of email users at 96%, Switzerland produces the fifth-highest total carbon footprint on the list, with an estimated 1,951 tons of CO2 emitted daily from 5.9 billion spam emails.

    Belgium ranks sixth with the second-highest amount of daily total carbon emissions at 2,083 tons. However, the country’s per capita CO2 emissions stand at 187.1 grams, which keeps it outside the top five in this category. Belgium has 86.2% of its population, or roughly 10.1 million people, using email, sending out 6.3 billion spam emails each day.

    Sweden ranks seventh with a per capita carbon footprint of 175.3 grams. With 93% of its population or nearly 10 million people, using email, Swedish email users send or receive about 5.8 billion spam emails daily, contributing to a total of 1,918 tons of CO2 emissions each day.

    The Netherlands ranks eighth, with the highest total daily carbon footprint of 2,347.9 tons from spam emails. Despite this large contribution, the per capita emission is relatively lower at 133.9 grams due to the high percentage of email users—90% of the population, or around 15.9 million people—sending a staggering 7.1 billion spam emails daily.

    Chile comes in ninth, with a per capita carbon footprint of 124.7 grams. Although only 67.3% of the population, or about 13.2 million people, uses email, this results in 5.5 billion spam emails being sent daily, leading to 1,818.8 tons of CO2 emissions each day.

    Australia rounds out the top ten with the lowest per capita carbon footprint among the listed countries, at 93.9 grams. Even though 73% of Australians, or approximately 19.5 million people, use email, the country still contributes 6.1 billion spam emails daily, resulting in a total carbon footprint of 2,017.2 tons per day.

    ZeroBounce founder and CEO Liviu Tanase commented on the study: “Spam emails are not just an annoyance; they have a significant environmental impact as well. Each spam email contributes to CO2 emissions, and the cumulative effect is substantial when billions are sent daily. This study highlights the hidden cost of digital communication on our planet, urging us to consider the environmental footprint of our online activities and take steps to reduce unnecessary email traffic.”

  • The Most Tech Addicted U.S .States: Study Reveals

    The Most Tech Addicted U.S .States: Study Reveals

    • Utah ranks first in the list of U.S. states most addicted to technology, having the highest percentage of smart home adoption and a high internet density.
    • Florida residents hold a massive lead in tech-related searches, suggesting that the state has one of the most tech-interested populations.
    • Nevada has the second-highest average daily screen times, a high percentage of smart homes, and a substantial internet user density, showcasing its residents actively use technology daily.

    A recent study conducted by ZeroBounce analyzed data across U.S. states using key metrics such as the percentage of homes with smart devicesinternet users per square miletech-related search queries, and average screen time to explore the top tech-addicted U.S. states. The research provides a ranking based on a composite score that reflects each state’s overall tech adoption and usage.

    Findings summed up:

    State% of People with “Smart Homes”% Internet Users per sq MileSearches for tech-related KeywordsAverage Screen Time Per CapitaOverall ScoreRank
    Utah27.889.29501004:51:000.757623451
    Maryland27.682.382578005:36:180.731240672
    Washington2486.81717005:39:420.728770513
    Florida18.579.2252039005:42:540.699054484
    Georgia22.278.1281025005:33:000.642091715
    Nevada25.379.19256005:40:480.633419786
    Rhode Island23.182.55887004:56:060.577066337
    Massachusetts24.288.544824001:15:000.557429998
    Arizona27.382.46581001:46:480.552233229
    New Hampshire23.392.129101001:45:360.5270133710

    Utah ranks first among U.S. states most addicted to technology, leading with the highest percentage of smart homes (27.8%) and a high internet user density of 89.29 users per square mile. The state also records 50,100 tech-related searches and 4 hours and 51 minutes of daily screen time, resulting in the highest overall score of 0.7576.

    Maryland ranks second, demonstrating strong tech usage with the second-highest smart home adoption rate (27.6%) and 82.382 internet users per square mile. Maryland also registers 57,800 tech-related searches and 5 hours and 36 minutes of screen time.

    Washington comes in third, with a 24% smart home adoption rate and 86.81 internet users per square mile. The state shows a high tech curiosity, recording the second-highest search volume and an average daily screen time of 5 hours and 39 minutes.

    Florida ranks fourth, standing out by its highest tech-related search volume of 203,900 searches. Florida residents spend the most time on-screen daily, with 18.5% of its residents adopting smart home systems.

    Georgia holds fifth place, with 22.2% smart home adoption and 78.128 internet users per square mile. The state records 102,500 tech-related searches and 5 hours and 33 minutes of daily screen time, leading to an overall score of 0.6421.

    Nevada ranks sixth, showcasing 25.3% smart home adoption and 79.19 internet users per square mile. Nevada residents enjoy the second-highest daily screen time of 5 hours and 40 minutes and conduct 25,600 tech-related searches on Google.

    Rhode Island ranks seventh, with 23.1% of homes equipped with smart technology and 82.558 internet users per square mile. The state registers 8,700 tech-related searches and 4 hours and 56 minutes of daily screen time.

    Massachusetts ranks eighth with a 24.2% smart home adoption rate. The state has the second-highest tech-related search volume at 82,400 and an overall score of 0.5574.

    Arizona ranks ninth, having a high smart home adoption rate and 82.46 internet users per square mile. The state records 58,100 tech-related searches, and residents spend 1 hour and 46 minutes on screens daily.

    New Hampshire rounds out the top ten, leading with the highest internet user density of 92.129 users per square mile and a 23.3% smart home adoption rate. The state records 10,100 tech-related searches, and residents enjoy 1 hour and 45 minutes of daily screen time.

  • US: Expert Warns Homeowners to Protect Their Smart Home Security from Hackers

    US: Expert Warns Homeowners to Protect Their Smart Home Security from Hackers

    How to secure your home from cyber threats with expert-recommended strategies

    Key Findings:

    • Recent U.S. data breach highlights significant vulnerabilities in personal data protection
    • Expert warns homeowners to take proactive steps to secure their smart home security systems against potential hacking attempts
    • Isolating security cameras on a dedicated network can prevent unauthorized access and improve overall system security

    A recent data breach in the U.S., which is alleged to have compromised an astonishing 2.9 billion people’s personal data globally—including sensitive information such as Social Security numbers—has raised significant concerns regarding the safety of online data and the threat of breaches.

    As more homeowners integrate smart technology into their security setups, the risk of hackers exploiting these systems increases. With 72% of homeowners opting for some form of security system and over 39 million U.S. households using alarm systems, safeguarding these digital devices from cyber threats is crucial. Home security is no longer just about physical protection—securing the digital components of your home is equally important.

    Security experts at Automatic Technology (ATA), say “We’ve seen how easily overlooked vulnerabilities, such as those in smart cameras, can be exploited by hackers. It’s necessary to implement security measures to protect your home and family.”

    10 Ways to Keep Your Smart Home Security Systems Safe from Hackers, According to ATA:

    1. Update Firmware Immediately Upon Release: Regular firmware updates are important as they address newly discovered vulnerabilities. Enable automatic updates or check for updates through your system’s app or website. Perform updates as soon as they’re available, ideally setting a reminder to check monthly.
    2. Replace Default Passwords with Passphrases: Default passwords are easily guessable and can be a major security risk. Replace them with long, unique passphrases that combine random words, numbers, and symbols. Change default passwords immediately after setup and review them annually.
    3. Search for Brands with Strong Security Track Records: Brands with a history of robust security practices are less likely to have vulnerabilities. Research brands known for their commitment to security updates and data protection before making a purchase. Conduct this research before buying or upgrading your system.
    4. Use a VPN for Remote Access: A Virtual Private Network (VPN) encrypts your internet connection, protecting data transmitted between your device and your security system. Use a VPN whenever accessing your system remotely to ensure that data remains secure.
    5. Disable UPnP on Your Router: Universal Plug and Play (UPnP) can open ports on your router, potentially allowing unauthorized access to your security devices. Disable UPnP in your router’s settings to close this vulnerability. Do this as soon as you set up your router and review settings periodically to ensure continuous security.
    6. Segment Your Home Network: Isolating your security devices, such as cameras, on a separate Wi-Fi network can protect them if your primary network is compromised. Set up a dedicated network specifically for your security systems and review your router’s settings for options to segment and secure this network effectively.
    7. Conduct Regular Penetration Testing: Penetration testing helps identify vulnerabilities before hackers can exploit them. Hire a cybersecurity professional or use testing tools to simulate attacks and uncover weaknesses.
    8. Choose Systems with Encrypted Data Storage: Encryption ensures that your security footage and data remain protected even if accessed. Opt for systems that offer strong encryption standards for data storage. Evaluate encryption capabilities when purchasing or upgrading your system.
    9. Monitor Third-Party App Permissions: Third-party apps connected to your security system can introduce vulnerabilities. Regularly review and limit app permissions to reduce risks. Check app permissions monthly or when adding new apps. This practice helps prevent unauthorized access and ensures that only necessary apps have data access.
    10. Implement Device-Based Authentication: Device-based authentication restricts access to your security system to pre-approved devices only. Set up authentication protocols to ensure that only authorized devices can connect. This adds an extra layer of security, preventing unauthorized devices from accessing your system.

    A spokesperson for Automatic Technology commented:

    “Vigilance is the key to prevention. Your initial investment in advanced security measures – whether it’s isolating devices on dedicated networks, employing encrypted data storage, or implementing device-based authentication – is a small price to pay compared to the potential fallout of a security breach.

    “A breach can expose personal and sensitive information and create a slippery slope of security issues that could compromise your entire household. The financial and emotional costs of dealing with such an event are tremendous. Having worked on numerous cases where homeowners suffered due to insufficient security measures, we can’t stress enough the importance of staying ahead of these threats.

    “Our advice? Don’t wait for a wake up call. Take the necessary stops now to protect your home and those in it.”

    Sources

    • Statistics of 2.9 billion records being stolen was reported by CNBC
    • Statistics on percentage of home security systems and alarm systems came from SafeHome.org
  • How Work Apps Have Drastically Expanded in File Size Over the Past Decade

    How Work Apps Have Drastically Expanded in File Size Over the Past Decade

    As our reliance on digital tools increases, so does the size and complexity of the apps we use daily. A recent study by TRG Datacenters analyzed the file sizes of various apps over the past ten years, specifically focusing on four major categories: communication, navigation, work, and social media. The research reveals significant growth in file sizes, particularly in work-related apps like Asana and Trello, which have seen increases of 1000% since 2014. This article explores these findings, highlights the reasons behind these increases, and examines what it means for users, developers, and businesses.

    Overview of the Study

    The study aimed to track data volume growth in popular apps over the past decade. By using the Wayback Machine, researchers at TRG Datacenters traced download sizes over time and examined trends in app development. The study also gathered data on the most sold phones from 2014 to 2024, specifically focusing on the photo, video, and non-expandable memory characteristics of these devices. Comparing the storage capabilities of phones with the increasing sizes of apps, the study provides a comprehensive view of how technology has evolved to meet the growing demand for data storage.

    Key Findings

    1. The Dramatic Growth of Work Apps
    Work apps saw the most significant growth in file size, particularly Asana and Trello, which both expanded by 1000% from 5 MB in 2014 to 55 MB in 2024. These increases reflect how these tools have evolved into comprehensive project management platforms, incorporating features such as:

    • Collaborative tools: The ability to share files, assign tasks, and collaborate in real-time.
    • Integrations: Seamless connections with other work tools like Slack, Google Workspace, and Microsoft Office.
    • Task-tracking features: Advanced tracking capabilities that allow for greater project management efficiency.

    These changes are part of a broader trend in the app world, where users demand more robust functionalities, leading to larger file sizes.

    2. Communication Apps Expanding in File Size
    Communication apps like Slack and Zoom have also experienced significant growth in file size. Slack, a platform that started as a simple messaging tool, has evolved into a complete workspace communication hub. Its file size has grown by 500%, from 10 MB in 2014 to 60 MB in 2024, reflecting the addition of features like:

    • Multimedia messaging: Support for sending and receiving images, videos, and files.
    • Third-party integrations: Connections with apps like Asana, Trello, and Dropbox.
    • Advanced search: Improved search capabilities for finding past messages and files.

    Similarly, Zoom has grown from 15 MB to 65 MB, a 333% increase, due to the platform’s expansion to support high-quality video conferencing, webinars, and virtual collaboration tools. Zoom’s growth in size reflects its pivotal role during the pandemic and its continued importance in remote work and education.

    3. LinkedIn’s Evolution into a Media-Rich Platform
    LinkedIn, the go-to social media platform for professionals, has also seen a substantial file size increase of 529%. In 2014, LinkedIn’s app was 35 MB, and today, it stands at 220 MB. This growth is tied to LinkedIn’s expanded role as not just a networking platform but also a place for:

    • Educational content: LinkedIn Learning offers a vast library of courses for skill development.
    • Media-rich posts: Users now share more videos, images, and articles, increasing the app’s need for storage.
    • Job search and applications: The platform now includes comprehensive job search tools, company reviews, and job application tracking.

    These added functionalities have made LinkedIn more resource-intensive, contributing to its file size increase.

    Other Notable Findings

    Photo File Size Growth
    Interestingly, the average file size of photos has only seen a moderate increase of 217% from 3 MB in 2014 to a peak of 9.5 MB in 2023, before slightly decreasing to 7 MB in 2024. This growth reflects advancements in camera technology and higher image resolution, but the slight reduction in 2024 suggests that software optimization has begun to counterbalance the larger image files.

    Video File Size Growth
    The file size of videos per minute, however, has surged by 733%, growing from 60 MB in 2014 to 500 MB in 2024. The growth is largely due to the transition from standard definition to 4K and higher-quality video formats, which demand significantly more storage space for each minute of footage. As video content becomes more integral to both personal and professional use, the need for larger storage capacities has increased accordingly.

    The Rise of Non-Expandable Memory in Mobile Devices

    The study also examined the rise in non-expandable memory in mobile devices. In 2014, the average device had 16 GB of storage, but by 2024, the average had increased by 2300% to 384 GB. This massive growth in storage reflects the rising demands placed on devices by apps, media, and other data. Modern apps are becoming more feature-rich, which leads to larger file sizes, and users now store more high-definition media, which also requires more space.

    What’s Driving the Growth in App Sizes?

    Several factors are contributing to the rapid expansion in app file sizes:

    • Feature Creep: As apps become more complex, new features are continually added to meet user demands, making them larger. For instance, apps that started with basic functionalities, like Trello for task management or Zoom for video calls, have evolved into full-featured platforms.
    • Richer Media: Many apps now support the sharing and creation of high-definition media, such as 4K video and high-resolution photos. This media requires more storage, which in turn increases app sizes.
    • Improved Graphics and User Interfaces: Modern apps offer more visually appealing user interfaces, with high-quality graphics and animations, which require more space.
    • Offline Capabilities: Some apps now allow users to work offline, which often means they store more data locally, increasing the app’s size on the device.

    Implications for Users and Developers

    For users, the rise in app file sizes means that more storage is needed on mobile devices and computers. As apps become more resource-intensive, users with older devices may struggle to find enough space for all the tools they need. Additionally, larger apps can lead to slower performance, especially on devices with limited RAM or older processors.

    For developers, the growing file sizes of apps present new challenges in optimizing performance and storage. While users expect rich features and high-quality media, they also expect apps to run smoothly and not consume excessive storage. Balancing these demands requires careful optimization and innovation.

    The Future of App Development

    As we look to the future, there are several trends that could influence how app sizes continue to grow or stabilize:

    • Cloud Integration: More apps may move data storage and processing to the cloud, reducing the amount of data stored locally on devices. This could help mitigate the rise in app sizes.
    • Data Compression: Advances in data compression techniques could allow apps to store more information in less space, helping to manage file size growth.
    • Modular Apps: Some developers are exploring the idea of modular apps, where users can download only the features they need. This approach could keep file sizes more manageable while still offering robust functionality.

    Conclusion

    The study highlights how much work apps have expanded in file size over the past decade, driven by increasing user demands for richer features and better performance. While the growth in non-expandable memory in devices has helped accommodate these larger apps, the trend shows no signs of slowing down. As developers continue to push the boundaries of what apps can do, balancing size and performance will be key to ensuring a positive user experience.